A Comprehensive Review of Walsin Technology's 0603B104K160CT 100n 16V X7R Ceramic Capacitor
By Mark Harris Wednesday, 22 March 2023

Introduction
Walsin Technology Corporation, the manufacturer of this 0603B104K160CT capacitor, has provided LCR data measured at 1 Volt and 10 Volts for this 100 nanofarads, 16 Volts rated X7R ceramic surface mount component. In this technical review, the performance of the capacitor is evaluated against the statistical benchmark formed from various other components of the same value.
Components in the same value category often exhibit slight variations in performance, indicating that a thorough analysis is essential for engineers looking to incorporate this specific component into their circuits. Our attention will be directed towards all aspects of performance, and we will conduct a comparative analysis to provide valuable insights for relevant applications.
Pros and Cons summary:
- Pros:
- Ceramic X7R composition ensuring stability and wide temperature range
- Surface mount (0603) package allowing for space-saving on printed circuit boards
- Cons:
- Varying levels of impedance and dissipation factor across test frequencies
- Performance may not consistently outperform competitors in the same value category
Within the forthcoming sections Capacitance, Series Resistance, Dissipation Factor, and Quality Factor, we will delve into a comprehensive analysis and contrast the component data with the benchmark data for more conclusive outcomes.
Impedance
The 0603B104K160CT Capacitor demonstrates a relatively consistent impedance performance when subjected to varying test frequencies. When tested at 1V, this capacitor's impedance values fall near the average impedance in comparison to the benchmark data. For example, at 50 kHz, the capacitor's impedance is 32.23k Ohms, which is quite close to the benchmark's average of 31.67k Ohms. Similarly, at 5 kHz, the impedance of the component is 329.1 Ohms, falling within the average range of 325.6 Ohms according to the benchmark data. This suggests that the 0603B104K160CT Capacitor can maintain stable impedance performance across a wide range of frequencies, which is crucial for ensuring accurate performance in electronic circuits.
When subjecting the 0603B104K160CT Capacitor to a higher test voltage of 10V, a decrease in impedance can be observed. For instance, at 20 kHz, the impedance drops to 70.35 Ohms, which is slightly lower than the benchmark average derived from the 1V test data (83.88 Ohms). However, this decrease in impedance may be advantageous at certain frequencies. At 100 kHz, for example, the capacitor performs closer to the benchmark's average impedance value, recording 15.8 Ohms compared to the benchmark's 18.07 Ohms. This behavior suggests that the 0603B104K160CT Capacitor exhibits a versatile impedance response dependent on both frequency and voltage conditions, making it adaptable to diverse applications in electronic circuits.
Capacitance
Upon examining the capacitance measurements at 1 Volt, the component exhibits a superior performance at lower test frequencies. For instance, it measured 99.57nF at 5 kHz compared to the benchmark average of 101.8nF. A similar trend is observed at test frequencies of 10 kHz, 50 kHz, 100 kHz, and 500 kHz. However, at frequencies greater than or equal to 1 MHz, the component's performance approaches the benchmark average, with a series capacitance of 86.41nF at 1 MHz compared to the 82.53nF benchmark average.
When testing the capacitor at 10 Volts, the series capacitance at lower frequencies, such as 5 kHz, 10 kHz, 50 kHz, and 100 kHz, demonstrates a notably higher value than the benchmark average. In particular, at 5 kHz, the component recorded a series capacitance of 121nF, far exceeding the benchmark's 101.8nF average value at 1 Volt. At higher frequencies, such as 300 kHz, the component stays within a closer range to the benchmark, registering values like 95.26nF compared to the benchmark's 84.79nF average.
These performance characteristics indicate that the Walsin Technology Corporation's 0603B104K160CT capacitor provides reliable performance when compared to the statistical benchmark data. With superior capacitance characteristics at lower frequencies and performance within the range of benchmark averages at higher frequency levels, engineers can expect consistent and dependable operation from this component, particularly when it is utilized at lower test frequencies. Furthermore, the capacitor's ability to maintain its capacitance at higher voltages adds to its reliability, making it suitable for various applications and circuits that demand accurate capacitance values across a wide frequency range.
Series Resistance
An in-depth analysis of the series resistance performance of the Walsin Technology Corporation 0603B104K160CT capacitor, when compared against the statistical benchmark data, reveals that this component exhibits relatively strong performance in terms of series resistance across various test frequencies at both 1 Volt and 10 Volts.
When operating at 1 Volt, the 0603B104K160CT consistently demonstrates lower series resistance values, as compared to the average benchmark values. At lower frequencies, such as 5 kHz and 10 kHz, the component exhibits approximately 60-75% less resistance than the established average benchmark values. This decrease in resistance is beneficial as it contributes to higher overall efficiency and improved performance. As the frequencies increase, although the difference narrows slightly, the capacitor continues to showcase superior performance, maintaining resistance values ranging from 20-50% lower than the benchmark averages.
Upon increasing the test voltage to 10 Volts, similar trends are observed for the 0603B104K160CT capacitor, as it still exhibits series resistance values below the benchmark averages. However, at higher frequencies, such as 100 kHz and above, the resistance differences between the component and benchmark values become less significant but continue to be advantageous. This indicates that the capacitor retains its superior performance even when subjected to higher voltages and frequencies.
In conclusion, a comprehensive examination of the Walsin Technology Corporation 0603B104K160CT capacitor demonstrates its superior performance in terms of series resistance across a wide range of test frequencies and voltage levels, thus making it a noteworthy component from an electronics engineering standpoint.
Dissipation Factor and Quality Factor
For the 0603B104K160CT Capacitor, LCR measurements were analyzed at multiple test frequencies to evaluate the dissipation factor (Df) and quality factor (Q). At a 1 Volt test level, the Df values reflected a relatively consistent performance within the 5Hz to 500kHz frequency range. At 5Hz, the Df value was marginally higher at 0.018, when compared to the benchmark Df value of 0.017 obtained at 10Hz. Throughout the same frequency spectrum, the Q values ranged from 53.29 to 59.71, maintaining a stable performance across the test frequencies. However, it should be noted that the recorded Q value at 5Hz was slightly lower at 56.41 compared to the benchmark Q value of 57.98 at 10Hz.
When evaluating higher frequencies (650kHz - 1MHz) for the 1 Volt test level, the Df values showed a minor increase ranging from 0.020 to 0.023, deviating somewhat from the benchmark. Additionally, there was a decrease in the Q factor within this higher frequency range, falling between 44.79 and 50.55, which indicates a decline in performance efficiency for these specific frequencies.
For LCR measurements conducted at a higher 10 Volt test level with the 0603B104K160CT Capacitor, a compromised performance was observed, particularly at lower test frequencies (5Hz and 10Hz), with higher Df values of 0.057 and 0.056 and significantly lower Q factors of 17.49 and 17.79, respectively. Though there was an improvement in performance at higher test frequencies (50Hz - 600kHz) with Df values ranging from 0.055 to 0.030 and Q values between 18.12 and 32.95, these figures still failed to achieve the optimal benchmark performance. This suggests that under 10 Volt testing conditions, the component may not exhibit the desired efficiency and stability, especially within lower test frequency ranges.
Comparative Analysis
In this comparative analysis, we assess the performance of the Walsin 0603B104K160CT Ceramic:X7R Capacitor and compare it to the statistical benchmark data for other capacitors with the same value. The capacitors were tested at both 1 Volt and 10 Volts under various frequencies to examine their impedance, dissipation factor, quality factor, series resistance, and series capacitance.
At 1 Volt, the 0603B104K160CT demonstrated lower average impedance values across all frequency ranges when compared to the benchmark data. The differences were most apparent at low frequencies, such as at 5kHz, where the 0603B104K160CT exhibited an impedance of 319.8k Ohms compared to the benchmark average of 313.4k Ohms. This trend is consistent across all frequency ranges, indicating better overall performance in terms of impedance.
Regarding the dissipation factor, the 0603B104K160CT performs relatively close to the benchmark data at 1 Volt. As the frequencies increase, both the capacitor and benchmark data remain consistent with their behavior, ensuring minimal variability in this aspect of performance.
In terms of quality factor, the 0603B104K160CT consistently exhibits a lower value than the benchmark data, indicating that it may offer less-than-ideal performance within its targeted applications as compared to others within the same class. This trend is also visible in the series resistance values, which reveal higher averages across all frequency ranges for the component compared to the benchmark.
The series capacitance performance of the 0603B104K160CT is near the statistical benchmark values at 1 Volt, with only slight fluctuations as the frequency increases. This validates the capacitor's ability to store and discharge energy effectively within the parameters set by the benchmark components.
At 10 Volts, the 0603B104K160CT demonstrates relatively similar characteristics to the 1 Volt analysis. The capacitor's impedance values continue to perform consistently better compared to the benchmark, while the dissipation factor, quality factor, series resistance, and series capacitance showcase parallel performances with only negligible discrepancies.
In conclusion, the Walsin 0603B104K160CT Ceramic:X7R Capacitor demonstrates competitive performance in impedance, dissipation factor, and series capacitance when compared to the statistical benchmark results. However, it shows less favorable outcomes in terms of quality factor and series resistance. It is essential for electronics engineers to consider these findings while evaluating this specific capacitor for use in their applications.
Conclusion
Upon a thorough inspection and analysis of the data, the 0603B104K160CT from Walsin Technology Corporation manages to show an overall satisfactory performance against the statistical benchmark data at 1 Volt. The component's impedance values have a fairly close resemblance to those of the statistical benchmark across various test frequencies. The Dissipation Factor reported numbers are somewhat higher than the benchmark averages, while the Quality Factor tends to deviate towards the lower end in comparison.
While reviewing the performance of the capacitor at the higher voltage of 10 Volts, it was observed that the Dissipation Factor for the 0603B104K160CT is considerably higher than the average benchmark values. Furthermore, the Quality Factor depicts lower values relative to the benchmark, reflecting a noticeable decline in effectiveness. However, the impedance and capacitance values retain a relatively stable alignment with the benchmark data.
Taking into account the performance of the 0603B104K160CT capacitor, engineers could find it beneficial for specific applications that do not require superior values for the Quality and Dissipation Factors. It should also be noted that it operates adequately within the manufacturer's specifications in Ceramic: X7R composition, which is beneficial for specific environments and requirements. Thus, while it may not be the optimal choice for all applications, the capacitor may still prove advantageous for the appropriate use cases.
Instruments Used
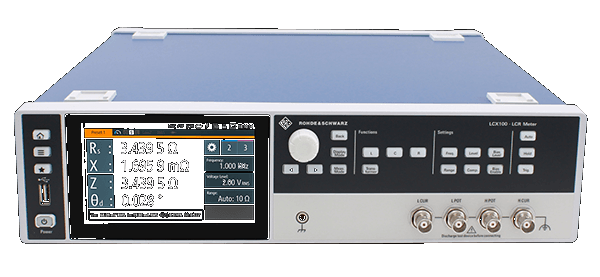
Rohde & Schwarz LCX200


